

A narrative review of glaucoma screening from fundus images
Introduction
Among ocular diseases, glaucoma is one of the main factors of blindness (1), by 2020 estimated to impact about 80 million people (2). Vision loss by glaucoma is not reversible, which is much different from myopia, cataracts and other ocular diseases (3). Glaucoma is like a silent thief. When many patients have not realized their bad situation, their sight has already been stolen (4). But if glaucoma can be screened in the early stage, the bad effects of vision loss can be mitigated or even avoided. Thus, it is requisite to carry out early screening to retain vision and keep quality of life.
Presently, there exist three methods for glaucoma screening: function-based visual field test, intraocular pressure (IOP) measurement and optic nerve head (ONH) assessment (5-7). Function-based visual field testing, uncommon in primary healthcare, needs professional perimetric instrument and therefore is unsuitable for screening. Despite as a significant risk factor, IOP is not that specific as an effective method for many glaucoma patients whose IOP is normal. Furthermore, visual symptoms often do not exist in early glaucoma. Compared with them, ONH assessment, which now is well-used by trained specialists, is a facile method for glaucoma detection. However, it is very expensive and time consuming for professionals to take ONH assessment, especially in large-scale screening. Therefore, it would be of benefit and significance to achieve the automation of ONH assessment.
The binary classification between healthy and glaucomatous subjects based on image features is one strategic approach for automatic ONH assessment (8-10). Image-level features are often used. As for the strategy, it is challenging and difficult for features selection and classification strategy (11). Following the clinical indicators is the other strategic approach. Like disc diameter (12), the vertical cup to disc ratio (CDR) (13), rim to disc area ratio (14), ISNT rule (15), peripapillary atrophy (PPA) (16), many risk factors of glaucoma are taken into account. In the above parameters, CDR is commonly accepted and well used by clinicians. As illustrated in Figure 1, CDR is calculated as the ratio of vertical cup diameter (VCD) to vertical disc diameter (VDD) (6). Generally, the larger CDR, the higher risk of glaucoma and vice versa. CDR acts as a big one in glaucoma screening and diagnosis. The key to automatically calculate CDR in fundus images is segmentation of optic disc (OD) and optic cup (OC). Thus, realizing segmentation of OD and OC accurately and automatically from fundus images is a meaningful work.

Currently there are various techniques used for OD, OC or, OD and OC segmentation (11,17,18). These techniques help clinicians and professionals to analyze or diagnose glaucoma with more accurate and specific information. The paper is an overview of research about the OD or OC segmentation for glaucoma screening from fundus images by our team in recent years and we wish it can provide guidance and bring inspiration to other researchers. In this paper, we introduce the segmentation-based methodologies as two parts: hand-craft feature and deep learning feature. The hand-craft feature method contains sliding window regression, superpixel level, image reconstruction, superpixel level low-rank representation (LRR) and so on.
We present the following article in accordance with the Narrative review checklist (available at: http://dx.doi.org/10.21037/aes-2020-lto-005).
Retinal image datasets
Most methodologies of OD and OC segmentation shown within this article are evaluated upon the following datasets. Among the datasets below, Singapore Chinese Eye Study (SCES) and Singapore Indian Eye Study (SINDI) datasets are private. A brief introduction of these datasets is provided in this section.
ORIGA dataset
The Online Retinal Fundus Image Dataset for Glaucoma Analysis and Research (ORIGA) contains 650 images, including 482 normal eyes and 168 glaucomatous eyes. The Singapore Eye Research Institute (SERI) acquired this dataset through Singapore Malay Eye Study (SiMES). The image dimension in this dataset is 3,072×2,048. The images are with well annotations by trained professionals.
MESSIDOR dataset
This dataset consists of 1,200 images in uncompressed TIFF format; With a research program sponsored by the French Ministries of Research and Defense, three ophthalmological departments achieve the images on a Topcon TRC NW6 nonmydriatic retinography. The retinography with a 45° field of view has a color video 3CCD camera. Risk of macular edema and retinopathy grade are offered by the medical experts.
REFUGE dataset
On MICCAI-OMIA Workshop 2018, Retinal Fundus Glaucoma Challenge (REFUGE, https://refuge.grand-challenge.org) (19) was held. This glaucoma challenge includes the following tasks: segmentation of disc/cup, glaucoma screening, and fovea localization. REFUGE dataset contains 1,200 fundus images with pixel annotations and has been divided to 3 subsets: 400 images for training, 400 images for validation and 400 images for test.
SCES dataset
This dataset was constructed in a screening study. The dataset constructed by SCES has 1,676 images with 46 glaucomatous eyes. There pictures are with two image dimensions: 3,888×2,592 and 3,504×2,336.
SINDI dataset
This dataset consists of 5,783 eye images with 5,670 normal eyes and 113 glaucomatous eyes. These images were acquired in the SINDI.
Evaluation criteria
This part will be stated in two aspects: segmentation metric and classification metric.
Segmentation metric
Absolute CDR error
in which CDRS is the CDR calculated by the segmented result and CDRG indicates the manual CDR from trained specialist.
Overlapping error (E) or non-overlap ratio (m1)
Overlapping error is also called non-overlap ratio in some paper. In the following equation, D indicates the segmented mask, and G denotes manual ground truth. Ground truth is the segmented reference images which are annotated accurately by ophthalmic professionals.
Relative absolute area difference (m2)
Classification metric
Receiver operating characteristic (ROC) curve and area under ROC curve (AUC)
As an important criterion, it is significant for assessing the classification performance. AUC indicates separability degree and ROC is a curve of probability. It shows the distinguishing capability of the model between classes. Higher the AUC, better the model. By analogy, higher the AUC, better the model is distinguishing between patients with disease and no disease. The ROC curve is plotted with true positive rate (TPR) against the false positive rate (FPR) where TPR is on y-axis and FPR is on the x-axis.
Sensitivity/TPR/recall
Sensitivity, also called TPR, recall, or hit rate in some fields, represents the correctly identified actual positives proportion. The larger the value of sensitivity, the larger the “sickness is judged to be sick” and the smaller the “missed diagnosis”. Sensitivity is calculated as follows:
TN indicates the number of true negatives and TP represents true positives. And FN is the number of false negatives.
Specificity
Specificity is called the true negative rate, too. It denotes the correctly identified negatives proportion. Larger the value of specificity, larger the “healthy is judged as healthy” and the smaller the “misdiagnosis”. Specificity is calculated as follows:
TP indicates true positives number. TN denotes the number of true negatives, FP denotes false positives number and FN represents false negatives number.
Balanced accuracy
Balanced Accuracy is obtained by normalizing true negative and true positive predictions by the numbers of negative and positive samples, respectively, and divides their sum into two. The equation is as follows:
Segmentation based methods
In this part, technical information will be introduced in details. Nine literature from international journals or conferences since 2011 are selected as the representative. Currently, the segmentation generally focuses on the methodologies as hand-craft feature and deep learning feature, as summarized in Table 1.
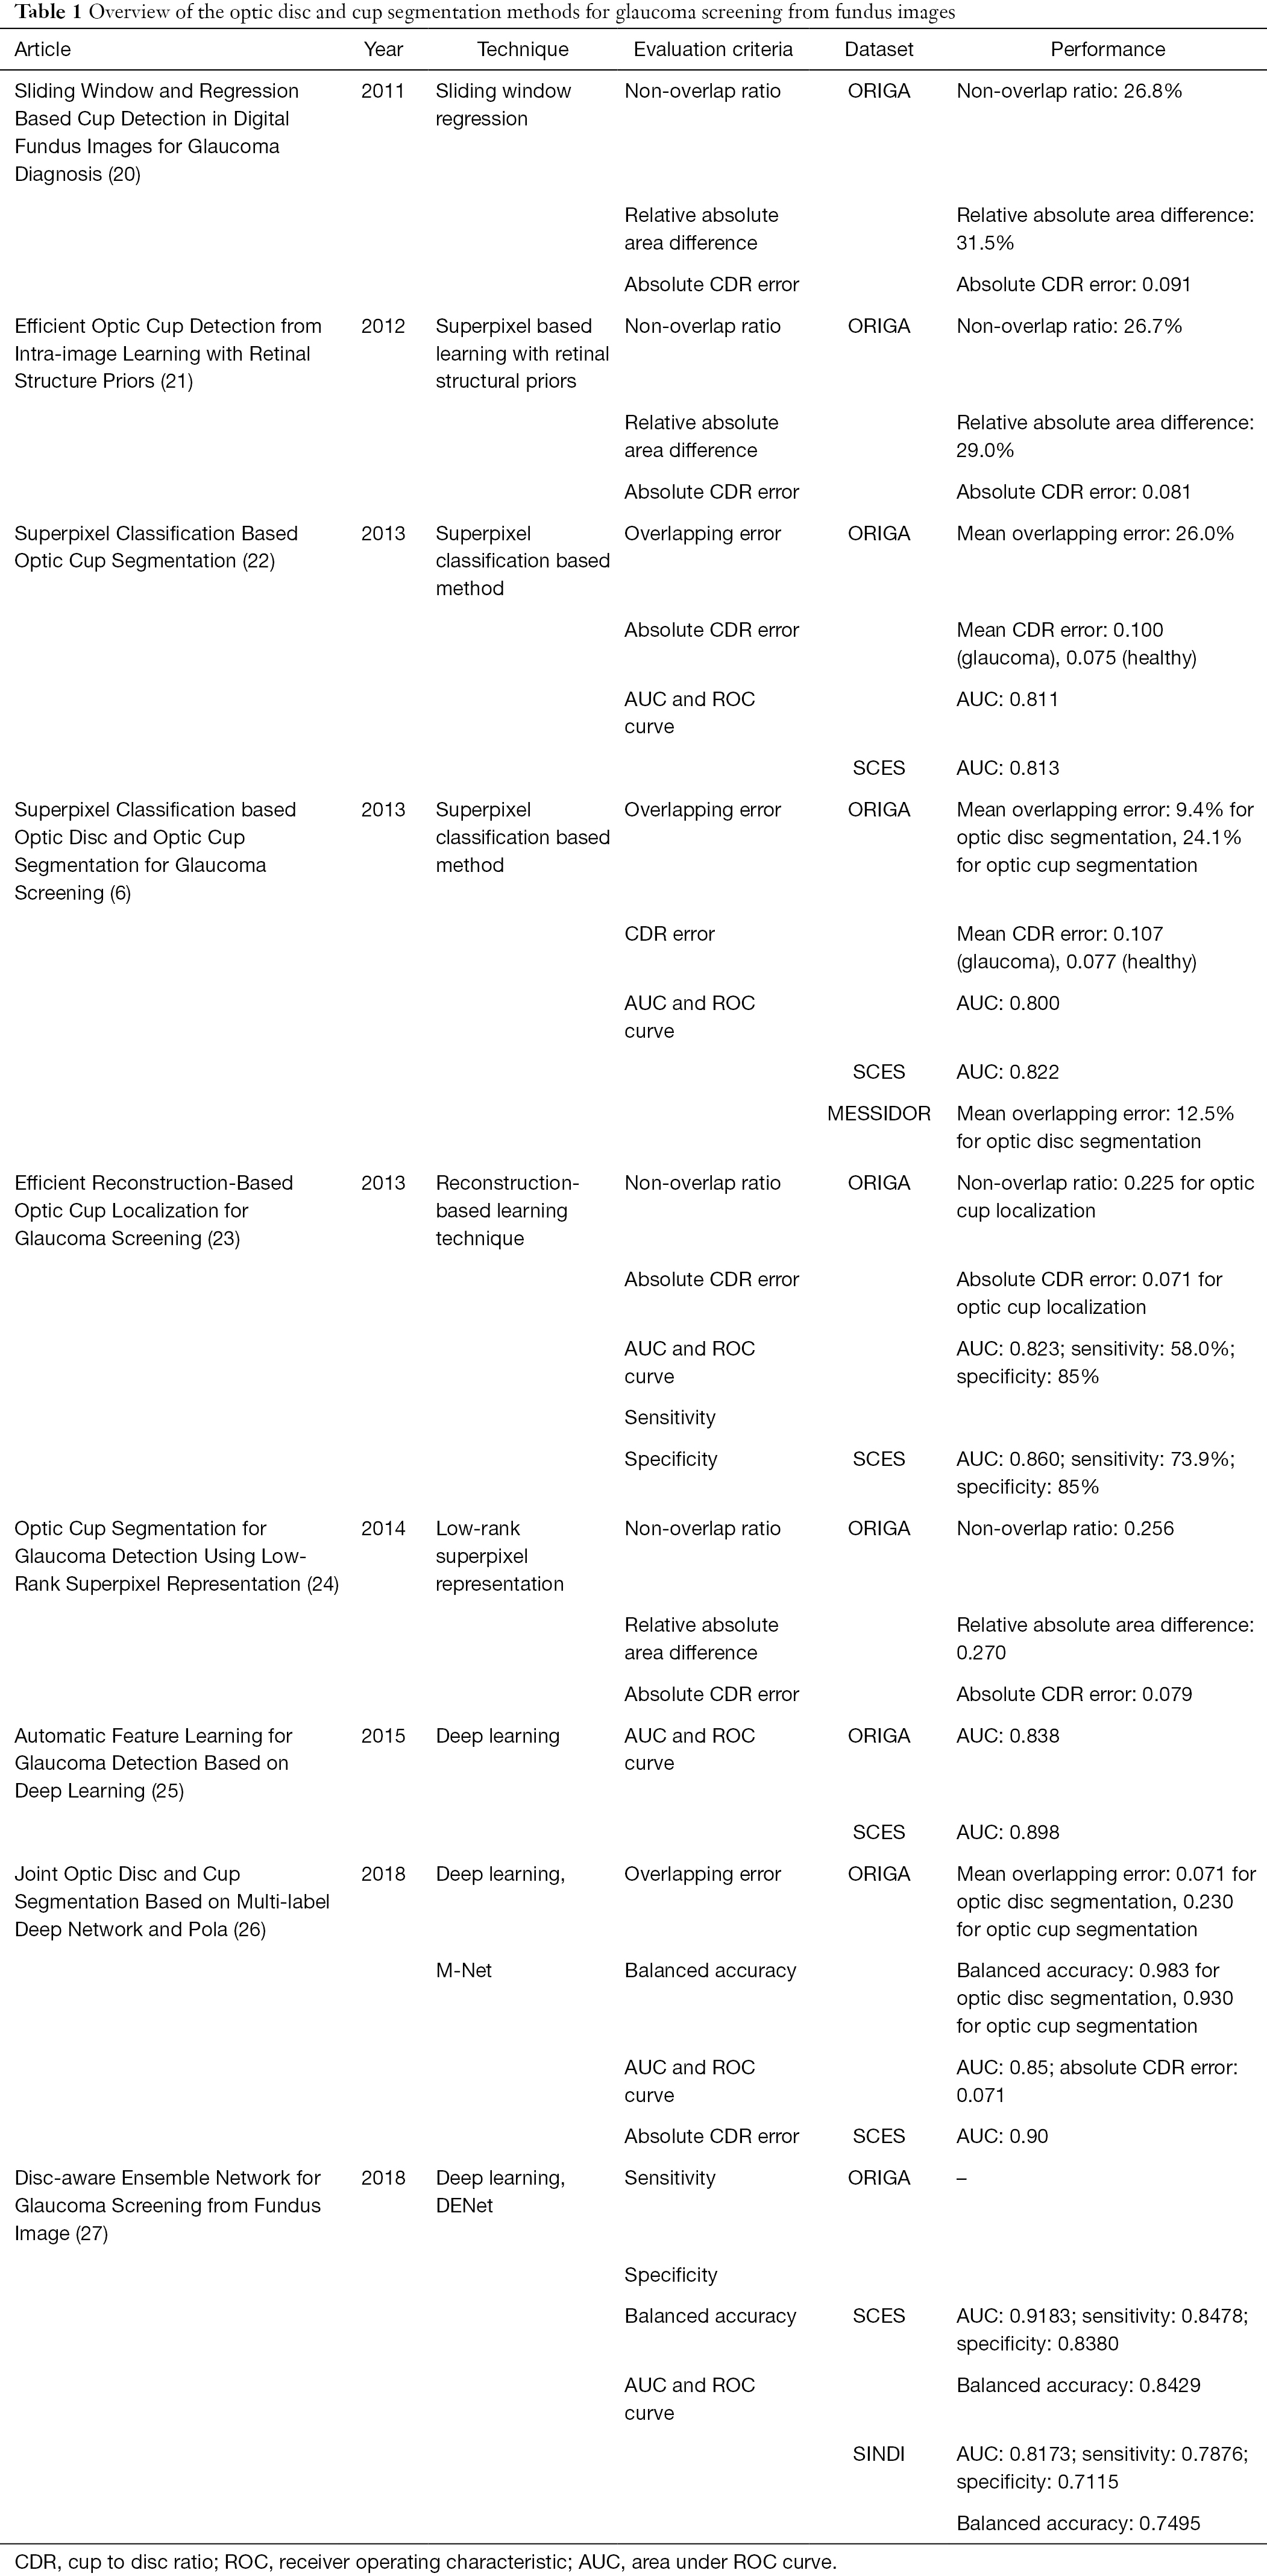
Full table
Hand-craft feature
In 2011, a sliding windows based machine learning method for cup detection was proposed (Figure 2) (20). The positioned disc was marked first through a centrally located ellipse which is arbitrary-sized, non-rotated. Then cup candidates within every disc image were obtained by a series of sliding windows in various sizes. In the following steps, a new region-based color features were extracted: (I) the saturation and hue values were scaled linearly to match color channels of blue and green and histogram the values; (II) redundant features were generated through various bin numbers. After that, the most discriminant and effective features were picked by the method based on group sparsity; (III) to achieve the original features of a candidate cup within the disc image, 3 types of features were concatenated over various bin numbers and 4 color channels, which leads to a feature dimension. Due to the fact that for a given channel, the optimal bin numbers and suitable color channels were not clear, so group sparsity constraint was adopted for features selection of cup localization. After picking features, with the assistance of non-linear radial basis function (RBF) kernels, the support vector regression (SVR) algorithm was employed for candidates ranking. And by the non-maximal suppression (NMS) strategy, ultimate outcomes were generated.

The suggested strategy obtained 26.8% non-overlap ratio with manually-annotated ground-truth, 0.091 absolute CDR error and 31.5% relative absolute area difference on ORIGA dataset. Although the method achieved good results, it has limitations. Owing to the suppression of the cup rim by NMS, it may be ineffective on big cups in some degrees. Besides, the sliding window approach needs a lot of computational cost.
After the sliding window technique, a lot of effort was put into the OC localization. With retinal structure priors, a superpixel based learning framework was presented in the next year (21). Flowchart for algorithms presented in Figure 3.

About the localization of the OC, there were 5 steps: (I) superpixel segmentation by Simple Linear Iterative Clustering (SLIC) algorithm. Superpixels can preserve local boundaries, which has great values; (II) blood vessel removal by the bottom-hat filtering algorithm. The purpose of this step is to avoid the effects of blood vessel on rim/cup classification. But the algorithm may be optimized in precision for the speed consideration at that time; (III) feature (location and color information) representation for superpixels; (IV) superpixel classification through support vector machine (SVM) classifier. Of course, such application is built upon retinal structure prior knowledge based on discussions with professional graders, namely, if superpixels are outside the ellipse which has the same center as disc and whose radius is 9/10 of disc radius, then they must be in the rim area, while if superpixels are inside the ellipse which has the same center as disc and whose radius is 1/5 of disc radius, then they must be in the cup; (V) classification label refinement by introducing contextual information. This introduction is realized through the way of superpixel labels filtration regarding similarity of features among superpixels in certain range.
This method gets non-overlap ratio of 26.7%, relative absolute area difference of 29.0% and absolute CDR error of 0.081 upon ORIGA dataset. It makes contributions in 3 main aspects. Firstly, the superpixel method is more effective and descriptive than pixel level. Compared with sliding window method, it saves more computational resources. Secondly, with structural priors upon relative disc and cup locations, the process of classifier learning can extract training samples from test image itself. Thus, the process does not depend upon training samples with pre-labels. Thirdly, by combining local context and structural priors, the article presents a classification refinement scheme.
Not long after, a method of the same type was published (22). The effectiveness of this method was validated again. In this paper (Figure 4), superpixel classification-based method was used. There are 3 steps: (I) the disc image was cropped into superpixels by an over-segmentation step; (II) features were computed via a step of feature extraction; (III) to estimate the boundary and classify every superpixel as rim or cup, a classification step was used. In feature extraction step, there are four challenges: (I) there is big difference in the contrast between cup and rim; (II) the illumination varies among images; (III) illumination of OD in the image is unbalanced; (IV) there exists high similarity in blood vessels of the rim and cup. As for these challenges, the following pointed methods were adopted: (I) enhance the image contrast: histogram equalization was applied for 3 contrast enhanced intensity maps; (II) the pixels mean intensities (MI) within superpixel were used; (III) calculate center surround statistics (CSS) by the variance and mean of these maps within superpixels to overcome the third issue; (IV) in current superpixel classification, context features also includes CSS and MI from adjacent superpixels to distinguish vessels of the two regions. A vessels superpixel usually possess more than two non-vessel neighbors via proper selection of desired superpixels number. Hence, better differentiation can be achieved between vessels of the rim and cup.

Tested on ORIGA and SCES dataset, outcomes present AUC as 0.811 and 0.813 in the two databases. Besides, compared with manual cup region, average overlapping error is about 26.0%. In this paper, due to the relatively obvious pallor of most glaucomatous subjects, MI shows its merits as a feature. CSS, which is not susceptible to illumination change, could help to reduce difficulties by uneven lighting. Additionally, there also exists limitations in CDR-based screening. To achieve performance improvement, combining factors including CDR is the expectation.
After these OC segmentation work for glaucoma screening, the approach based on superpixel classification was applied to the segmentation of OC and OD (6). Figure 5 shows the flowchart for algorithms in this work. For the purpose of automatic CDR measurement. The paper was presented as follows: (I) OD segmentation: the image was cropped into superpixels by a step of superpixel generation based on SLIC; then features from every superpixel was computed via a step of feature extraction, in which contrast enhanced histogram was for color information and CSS for texture variation in the PPA. After extracting features, to estimate the boundary and classify every superpixel as non-disc or disc, a classification step was employed. (II) OC segmentation: feature selection and superpixel differentiation for OC evaluation; (III) CDR calculation.

In the article, OC structure priors were incorporated. CDR was obtained according to the segmented OC and OD for glaucoma screening. In addition, a score of self-assessment reliability was introduced to make OD segmentation result more reliable. This assessment is of good significance but has rarely been used for OD segmentation. Usually, OD is much alike an ellipse. If segmentation based on superpixel and actual boundary are close, then before and after ellipse fitting the achieved boundary should be close. Or else, there seems less reliability of the results. Hence, taking self-assessment seems very important, especially in the cases where utilizers are noticed with potential risks.
Tested on ORIGA and SCES dataset, the suggested OC and OD segmentation approaches respectively obtain the AUC as 0.800 and 0.822. According to communication with specialists, such accuracy can be employed in glaucoma screening of a large scale. But there remain some features which can be improved. For instance, this approach may underestimate samples with big OC and over-estimate the small OC with unobvious pallor, because the classifier is mainly trained with medium-sized OC. This condition may be optimized by collecting more training samples or adopting multiple kernels. Besides, the model could not contain a few cases like sudden changes in boundary of OC or OD.
Besides superpixel method, there also exists the reconstruction-based method for OC localization. Different from former methods with low-level visual cues, this strategy (Figure 6) (23) treats the input picture entirely. Then with assistance of the codebook with reference images containing manual annotations, the OC parameters are inferred. The approach consists of two sections: first, realize disc segmentation and normalization by either Template Matching or Active Shape Model (ASM) with codebook pictures training, and then position OC through the suggested reconstruction-based strategy. In first section of OD segmentation and normalization, two techniques were utilized for the purpose of comparing different OD segmentation results on the OC localization. In the final results, with the comparison, the developed approach shows noticeable advance in accuracy of OC localization.

For the evaluation of OC localization accuracy on ORIGA dataset, the method acquires non-overlap ratio as 22.5% and absolute CDR error of 0.071, a remarkable progress compared with the state-of-the-art strategies at that moment. Results upon SCES dataset indicates this strategy gains AUC as 0.86, sensitivity as 73.9% and specificity as 85%. These results present the one-step reconstruction-based strategy possess more favorable features and faster speed than previous methods. The progress indicates the promising future of such method in screening practice. This method performance can be further improved via combing with a learning algorithm or introducing more data from multiple modalities.
In 2014, an unsupervised method for OC segmentation which does not require extra training data was developed (24). Flowchart of algorithms proposed in this paper has been illustrated in Figure 7.

This suggested approach framework has 4 major procedures: (I) crop the input OD into superpixels by SLIC; (II) owing to similarity of blood vessels from the rim or cup, get rid of superpixels lying on blood vessels; (III) no matter the superpixel belongs to rim or cup, annotate every one by the LRR based unsupervised method; (IV) achieve the only ellipse which represents the boundary of output OC via post-processing. The article has similar steps with the paper mentioned above (21) except that a new unsupervised LRR-based method for superpixel labelling was proposed.
Superpixel labeling is one of the key steps and it is an essential binary classification, where two categories correspond to rim and OC, separately. This problem has been settled in closed form with singular value decomposition (SVD) of the kernel matrix. Parameter selection is an open-ended question for LRR-based strategies. But for automatic determination of candidate values, an adaptive strategy was proposed in this work. A majority vote is then taken for ultimate outcome based on clustering outcome in regard to various candidate values.
Assessed on ORIGA dataset, outcomes were as expected. In this article, specifically, a few parameter candidates covering the entire range was determined first. And then by fusion between labels and corresponding candidate parameter via majority voting, ultimate mark of every pixel was achieved.
Deep learning feature
Having talked about sliding window regression, superpixel level, image reconstruction, super-pixel level LRR, deep learning feature methods will be illustrated in the following. With the development of scientific and technical development, more and more methods about deep learning was used for glaucoma screening (28,29). In 2015, an automatic feature learning (ALADDIN) for detection of glaucoma was presented (25). The approach framework is based on CNN, which includes 6 layers: 5 multiplayer perception convolutional layers and 1 fully-connected layer. And there also exists overlapping layers and response-normalization layers. For the glaucoma classification, the steps were listed as follows: (I) disc segmentation through Template Matching based on PPA elimination, PPA detection and constraint elliptical Hough transform; (II) dropout and data augmentation to expand the dataset. The step utilizes dropout for model combination and label preserving transformations. This step was to decrease overfitting on image data; (III) Automatic Classification by Softmax Regression. The Regression is a generalization of a logistic regression classifier, which considers as input the condensed feature maps of the pooling layer.
In this work, AUC and ROC curve were employed to assess the performance. ORIGA dataset was arranged as the training and SCES dataset was as the test data, AUC on SCES and ORIGA are 0.898 and 0.838, respectively. The AUC values are 0.823 and 0.860 on SCES dataset. Deep learning method is a hot topic in current research methods, and applications in glaucoma screening will be deeper and wider.
In 2018, deep learning techniques have developed to mature in some degrees. As for the segmentation of OD and OC, it has been addressed as a multi-label task and clarified via M-Net, an end-to-end deep network (26). Here, the M-Net works out the segmentation of OD and OC jointly. Figure 8 illustrates the M-Net framework, containing multi-label segmentation part and image polar transformation. It has four aspects: (I) a multi-scale layer employed to build an image pyramid input and get multi-level receptive field fusion; (II) a U-shape convolutional network, which is the main body structure to learn a rich hierarchical representation. This layer is to enhance segmentation quality effectively. There are several merits of the multi-scale input layer: (i) to avoid the large growth of parameters, multi-scale inputs were integrated into decoder layers; (ii) increase the network width of decoder path; (III) side-output layer to support deep layer supervision. This layer acts as a classifier that produces a companion local output map for early layers.

For collective OD and OC segmentation, based on Dice coefficient, a multi-label loss function was proposed. The function deals well with the multi-label and imbalance data of pixel-wise segmentation for fundus image.
In this work, for the performance improvement in OC and OD segmentation, a polar transformation was presented. (I) Spatial constraint. The redial relationship was transferred from polar transformation to redial relationship. It is convenient to utilize the layer-like spatial structure, particularly some segmentation approaches based on layers could be used for post-processing. (II) Equivalent augmentation. Due to the pixel-wise mapping of polar transformation, the data augmentation has the same effect on original fundus image and on polar coordinate. Augmenting with different scaling factor has the same effect with employing various transformation radius R. In this way, with polar transformation and various parameters, the data augmentation for deep learning can be done. (III) Balancing cup proportion. The polar transformation not only can increase the cup region via utilizing interpolation, but also can enlarge the OC proportion. Based on OD center, it flat the image. Such balanced areas assist to prevent overfitting in training and further enhance the performance of segmentation.
At last, the researchers assess the performance of M-Net on ORIGA dataset. The M-Net achieves state-of-the-art segmentation performance, with 0.07 and 0.23 for average overlapping error of OD and OC segmentation, respectively. The proposed strategy achieves highest performances with AUC as 0.90 and 0.85 on SCES and ORIGA datasets. In a word, the system produces state-of-the-art segmentation performance on ORIGA dataset. Meanwhile, based on the calculated CDR, the suggested strategy also achieved the satisfactory results for glaucoma screening on the two datasets.
Immediately after the M-Net, Disc-aware Ensemble Network (DENet) with novelty was developed (27). This network consists of four deep streams which corresponds to kinds of modules and levels of fundus image.
In the DENet, the whole image-level representation was realized via two streams. One is a standard framework of classification based on Residual Network (ResNet). And the other is the segmentation-guided network. Through the disc-segmentation representation, the second network fulfilled the OD region localization and generated a detection result.
Two loss functions were utilized in the whole fundus image level frameworks. Binary cross entropy loss function and Dice coefficient, the two are respectively for glaucoma detection layer and disc segmentation assessment. By standard stochastic gradient descent (SGD), the two functions are integrated into backpropagation efficiently. For the local disc region representations, the network employs two local streams: a standard classification network based on ResNet on the original local disc region, as shown in Figure 9, while the other stream focuses on the disc polar transformation.

The DENet achieved excellent results on the SINDI dataset (0.8173 AUC) and the SCES dataset (0.9183 AUC) compared to 5 state-of-the-art glaucoma screening baselines and the IOP method. The experiments on two glaucoma datasets denote the network is better than the state-of-the-art algorithms.
This paper contributes majorly in the following aspects:
- This proposed framework has an ensemble architecture, which can be further improved and applied flexibly, embedded into most of the existing networks.
- A segmentation-guided network is proposed with localization of disc region. Through embedding the disc-segmentation representation, the network can generate the screening result.
- The authors of this paper construct the SINDI dataset.
Summary
In this review article, we have comprehensively presented sliding window regression, super-pixel level, image reconstruction, super-pixel level LRR, deep learning methodologies for segmentation of OD and OC which assist to measure or assess CDR for automatic glaucoma screening. The diversity and complexity of ONH structure makes the glaucoma screening by CDR more challenging. But as we introduced above, every approach has its advantages and limitations. As an illustration, currently, blood vessels inside the disc often influence the disc boundaries inferior and superior. It is usually difficult to determine the cup nasal side boundary even manually due to the existence of blood vessels. Some approaches help to identify boundary of the disc and cup at these parts, but they may not contain some morphology like that cup or disc boundary presents a sudden change. Besides, most of the current methods were tested on limited datasets. In a word, there must be many imperfect or unknown things in ophthalmic images analysis, so there is still a long way to go. On one hand, we should strengthen technical development, on the other hand, we should try our best to make contribution to ecological development of the community.
Back to this paper, the main objective is to give a brief description of current segmentation methodologies and a quick overview. This article will provide a valuable reference for relevant professionals. For CDR calculation for glaucoma screening, CDR is just the reflection for a small part of the disc, while utilizing comprehensive factors or multimodal images is the promising future direction to furthermore enhance the performance.
Acknowledgments
Funding: This work was partially supported by the National Natural Science Foundation of China under Grant No. 61772118.
Footnote
Provenance and Peer Review: This article was commissioned by the Guest Editors (Daniel Shu Wei Ting, Hao-Tian Lin) for the series “The State-of-Art Deep Learning Technology in Ophthalmology” published in Annals of Eye Science. The article has undergone external peer review.
Reporting Checklist: The authors present the article in accordance with the Narrative Review checklist: available at: http://dx.doi.org/10.21037/aes-2020-lto-005
Conflicts of Interest: All authors have completed the ICMJE uniform disclosure form (available at: http://dx.doi.org/10.21037/aes-2020-lto-005). The series “The State-of-Art Deep Learning Technology in Ophthalmology” was commissioned by the editorial office without any funding or sponsorship. The authors have no other conflicts of interest to declare.
Ethical Statement: The authors are accountable for all aspects of the work in ensuring that questions related to the accuracy or integrity of any part of the work are appropriately investigated and resolved.
Open Access Statement: This is an Open Access article distributed in accordance with the Creative Commons Attribution-NonCommercial-NoDerivs 4.0 International License (CC BY-NC-ND 4.0), which permits the non-commercial replication and distribution of the article with the strict proviso that no changes or edits are made and the original work is properly cited (including links to both the formal publication through the relevant DOI and the license). See: https://creativecommons.org/licenses/by-nc-nd/4.0/.
References
- Kingman S. Glaucoma is second leading cause of blindness globally. Bull World Health Organ 2004;82:887-8. [PubMed]
- Tham YC, Li X, Wong TY, et al. Global prevalence of glaucoma and projections of glaucoma burden through 2040: a systematic review and meta-analysis. Ophthalmology 2014;121:2081-90. [Crossref] [PubMed]
- Baker H, Cousens S, Murdoch I. Poor public health knowledge about glaucoma: fact or fiction? Eye 2010;24:653. [Crossref] [PubMed]
- Shen SY, Wong TY, Foster PJ, et al. The prevalence and types of glaucoma in Malay people: the Singapore Malay Eye Study. Invest Ophthalmol Vis Sci 2008;49:3846-51. [Crossref] [PubMed]
- Garway-Heath DF, Hitchings R. Quantitative evaluation of the optic nerve head in early glaucoma. Br J Ophthalmol 1998;82:352-61. [Crossref] [PubMed]
- Cheng J, Liu J, Xu Y, et al. Superpixel classification based optic disc and optic cup segmentation for glaucoma screening. IEEE Trans Med Imaging 2013;32:1019-32. [Crossref] [PubMed]
- Chrástek R, Wolf M, Donath K, et al. Automated segmentation of the optic nerve head for diagnosis of glaucoma. Med Image Anal 2005;9:297-314. [Crossref] [PubMed]
- Meier J, Bock R, Michelson G, et al. editors. Effects of preprocessing eye fundus images on appearance based glaucoma classification. International Conference on Computer Analysis of Images and Patterns. Springer; 2007:165-72.
- Bock R, Meier J, Michelson G, et al. editors. Classifying glaucoma with image-based features from fundus photographs. Joint Pattern Recognition Symposium. Springer; 2007:355-64.
- Bock R, Meier J, Nyúl LG, et al. Glaucoma risk index: automated glaucoma detection from color fundus images. Med Image Anal 2010;14:471-81. [Crossref] [PubMed]
- Joshi GD, Sivaswamy J, Krishnadas S. Optic disk and cup segmentation from monocular color retinal images for glaucoma assessment. IEEE Trans Med Imaging 2011;30:1192-205. [Crossref] [PubMed]
- Hancox O, Michael D. Optic disc size, an important consideration in the glaucoma evaluation. Clinical Eye and Vision Care 1999;11:59-62. [Crossref]
- Damms T, Dannheim F. Sensitivity and specificity of optic disc parameters in chronic glaucoma. Invest Ophthalmol Vis Sci 1993;34:2246-50. [PubMed]
- Harasymowycz P, Davis B, Xu G, et al. The use of RADAAR (ratio of rim area to disc area asymmetry) in detecting glaucoma and its severity. Can J Ophthalmol 2004;39:240-4. [Crossref] [PubMed]
- Harizman N, Oliveira C, Chiang A, et al. The ISNT rule and differentiation of normal from glaucomatous eyes. Arch Ophthal 2006;124:1579-83. [Crossref] [PubMed]
- Jonas JB, Fernández MC, Naumann GO. Glaucomatous parapapillary atrophy: occurrence and correlations. Arch Ophthal 1992;110:214-22. [Crossref] [PubMed]
- Zheng Y, Stambolian D, O’Brien J, et al. Optic disc and cup segmentation from color fundus photograph using graph cut with priors. Med Image Comput Comput Assist Interv 2013;16:75-82.
- Almazroa A, Burman R, Raahemifar K, et al. Optic disc and optic cup segmentation methodologies for glaucoma image detection: a survey. J Ophthalmol 2015;2015:180972 [Crossref] [PubMed]
- Orlando JI, Fu H, Breda JB, et al. REFUGE Challenge: A Unified Framework for Evaluating Automated Methods for Glaucoma Assessment from Fundus Photographs. Med Image Anal 2020;59:101570 [Crossref] [PubMed]
- Xu Y, Xu D, Lin S, et al. Sliding window and regression based cup detection in digital fundus images for glaucoma diagnosis. Med Image Comput Comput Assist Interv 2011;14:1-8.
- Xu Y, Liu J, Lin S, et al. Efficient optic cup detection from intra-image learning with retinal structure priors. Med Image Comput Comput Assist Interv 2012;15:58-65.
- Cheng J, Liu J, Tao D, et al. Superpixel classification based optic cup segmentation. Med Image Comput Comput Assist Interv 2013;16:421-8.
- Xu Y, Lin S, Wong DWK, et al. Efficient reconstruction-based optic cup localization for glaucoma screening. Med Image Comput Comput Assist Interv 2013;16:445-52.
- Xu Y, Duan L, Lin S, et al. Optic cup segmentation for glaucoma detection using low-rank superpixel representation. Med Image Comput Comput Assist Interv 2014;17:788-95.
- Chen X, Xu Y, Yan S, et al. Automatic feature learning for glaucoma detection based on deep learning. International Conference on Medical Image Computing and Computer-Assisted Intervention; 2015: Springer.
- Fu H, Cheng J, Xu Y, et al. Joint optic disc and cup segmentation based on multi-label deep network and polar transformation. IEEE Trans Med Imaging 2018;37:1597-605. [Crossref] [PubMed]
- Fu H, Cheng J, Xu Y, et al. Disc-aware ensemble network for glaucoma screening from fundus image. IEEE Trans Med Imaging 2018;37:2493-501. [Crossref] [PubMed]
- Li Z, He Y, Keel S, et al. Efficacy of a deep learning system for detecting glaucomatous optic neuropathy based on color fundus photographs. Ophthalmology 2018;125:1199-206. [Crossref] [PubMed]
- Xiangyu Chen, Yanwu Xu, Damon Wing Kee Wong, et al. Glaucoma detection based on deep convolutional neural network. Annu Int Conf IEEE Eng Med Biol Soc 2015;2015:715-8. [Crossref] [PubMed]
Cite this article as: Cao X, Sun X, Yan S, Xu Y. A narrative review of glaucoma screening from fundus images. Ann Eye Sci 2021;6:27.

